ALP-CONNEX Management UI — User Handbook
Introduction
The ALP-CONNEX Management UI is a web-based application for managing your connector infrastructure. It provides a central interface to create and manage connectors across all supported protocols, define data mappings, design data flows visually, monitor system activity, and manage your software license.
This handbook describes each area of the application and how to use it.
Getting Started
Login
The application uses your organization's Microsoft Entra ID (Azure AD) account for authentication. When you open the application, you will be automatically redirected to the Microsoft login page if you are not already signed in.
After successful login, you are redirected to the Dashboard.
If the login fails, you will see a "Login Failed" page with the option to retry or return to the home page.
Navigation
The main navigation is located in the sidebar on the left side of the screen. It displays icon-based links to all areas of the application. Hover over an icon to see a tooltip with the section name.
| Icon | Section | Description |
|---|---|---|
| 🏠 | Dashboard | Overview and key metrics |
| 🔌 | Connectors | Connector management (all protocol types) |
| 🖥️ | Fleet Management | Edge device monitoring and management (Experimental) |
| 📋 | Connector Templates | Predefined connector configurations for fleet deployment (Experimental) |
| 🔄 | Mappings | Data point mappings |
| 📡 | Signals | IEC 104 address point management with live values |
| 🧠 | AI Insights | AI-assisted explanations, recommendations and operator chat (Experimental) |
| 🔀 | Workflow | Interactive workflow editor for data flow design (Experimental) |
| 🔗 | Streams | Data stream overview and monitoring |
| 📄 | Audit Logs | Activity history |
| 📊 | Process Updates | Real-time connector activity |
| 🔑 | Licensing | License management |
At the bottom of the sidebar you will find:
- Profile — View your account details and change the theme
- Logout — Sign out of the application
On mobile devices, the sidebar is hidden behind a hamburger menu. On desktop, it is always visible.
Breadcrumbs
Detail pages (e.g., Edit Connector, Edit Mapping, Signal Detail) show breadcrumbs in the header area, allowing quick navigation back to the parent list.
The header bar at the top shows your display name, email address, and your Microsoft profile photo (fetched from Microsoft Graph). If no photo is available, your initials are shown instead.
Dashboard
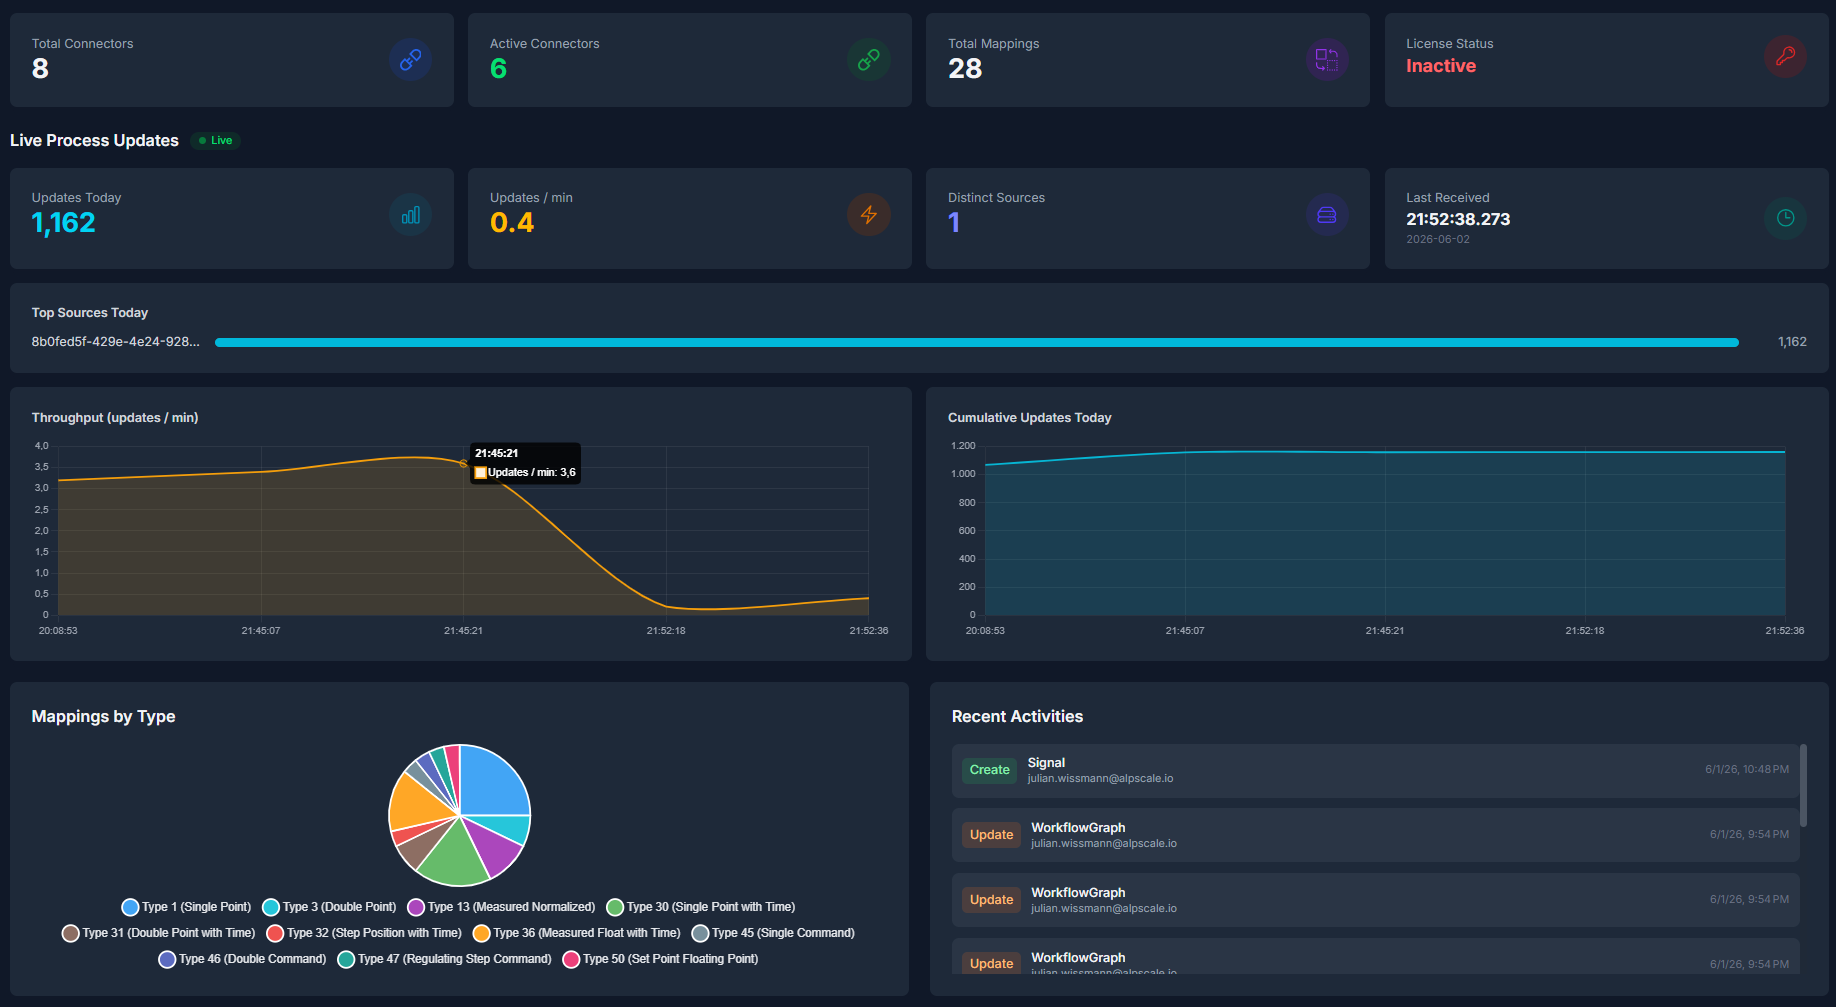
The Dashboard provides a quick overview of your system's current state. It is the first page you see after logging in.
Key Metrics
Four summary cards at the top show:
- Total Connectors — The number of connectors (MQTT + IEC 104) in the system.
- Active Connectors — How many connectors are currently active.
- Total Mappings — The total number of data point mappings.
- License Status — Whether your license is active or inactive, shown as a colored badge.
Mappings by Type
A pie chart visualizes how your mappings are distributed across the supported IEC 104 data types:
| Type | Description |
|---|---|
| Type 1 — Single Point | Boolean values (on/off, open/closed) |
| Type 13 — Measured Normalized | Normalized measured values (-1.0 to +1.0) |
| Type 30 — Single Point with Time | Boolean values with timestamp |
| Type 36 — Measured Float with Time | Floating-point measured values with timestamp (e.g., temperature, voltage) |
Recent Activities
A list of the latest actions performed in the system. Each entry shows:
- A colored action tag (Create, Update, Delete, or Configure)
- The name of the affected item
- The user who performed the action
- When it occurred
License Usage
Two progress bars showing:
- Used Connectors — How many connectors you are using relative to your license limit.
- Used Mappings — How many mappings you are using relative to your license limit.
When a limit is unlimited, an infinity symbol is shown.
Live Process Updates
The Dashboard displays real-time process update statistics, providing instant visibility into your system's activity:
| Metric | Description |
|---|---|
| Updates Today | Total number of data point updates received today |
| Updates / min | Current update rate per minute |
| Distinct Sources | Number of distinct connectors producing updates |
| Last Received | Timestamp of the most recent update |
A Top Sources Today bar chart shows which connectors are generating the most traffic.
The statistics update automatically without requiring a page refresh.
Connectors
Connectors represent protocol-specific adapter instances. The system supports the following connector types:
- MQTT Subscriber — Connects to an MQTT broker to ingest IoT sensor data.
- IEC 60870-5-104 Server — Serves data to SCADA/control systems.
- IEC 60870-5-104 Client — Reads data from remote control systems.
- HTTP-Server + Webhook — Exposes data via HTTP and pushes updates via webhooks.
- HTTP-Receiver — Accepts incoming data via HTTP POST requests.
Connector List
The connector list displays all connectors in a sortable, filterable table.
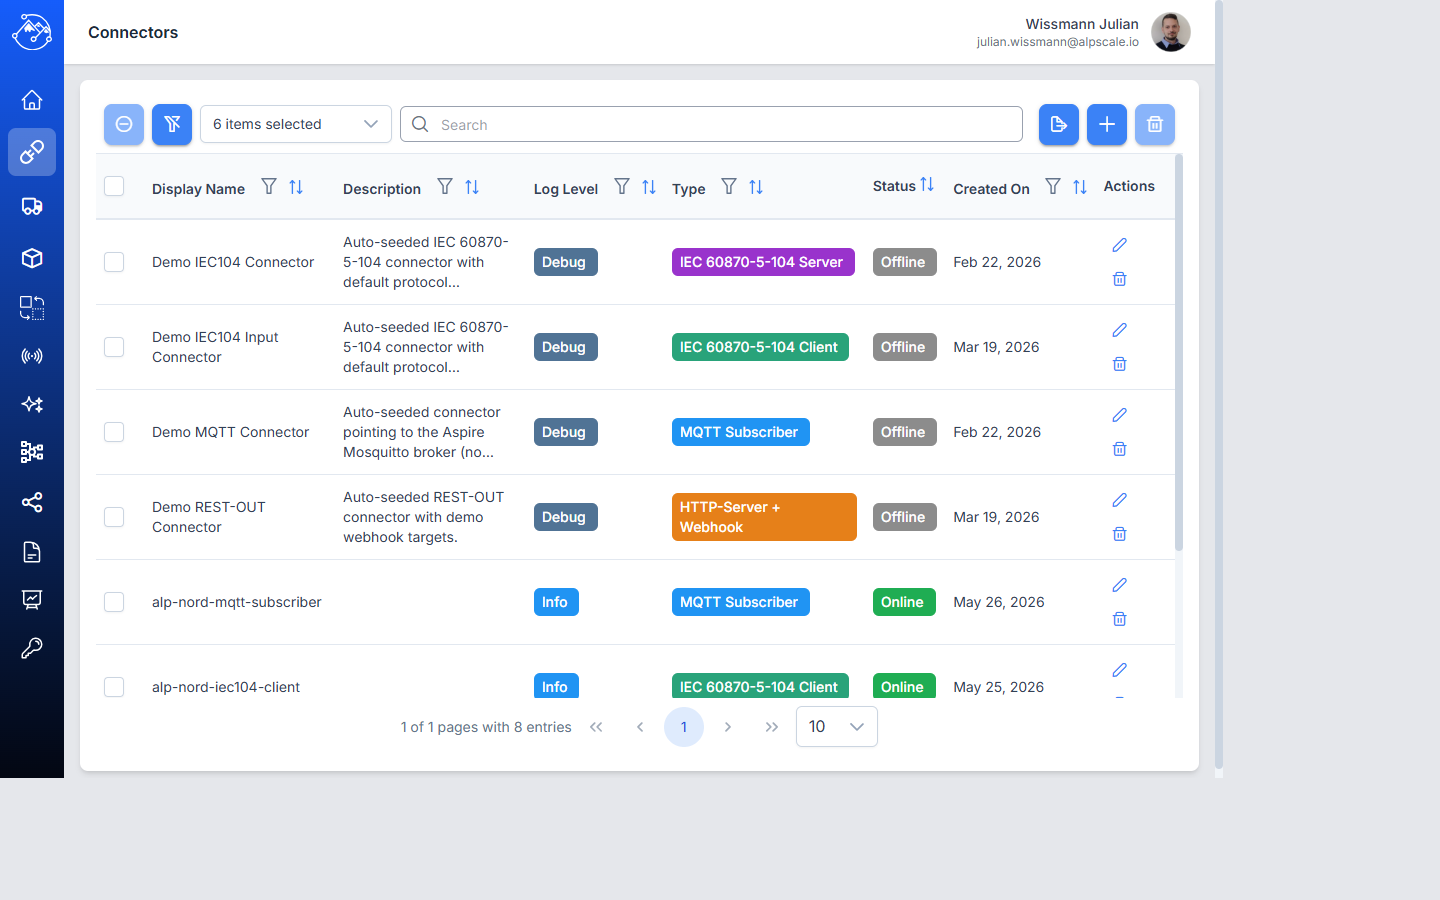
Available columns:
| Column | Description |
|---|---|
| Display Name | The connector name |
| Description | Optional description text |
| Log Level | Logging verbosity (Trace, Debug, Info, Warning, Error, Critical, Off) — shown as a colored tag |
| Type | The connector protocol type — shown as a colored tag |
| Status | Live connection status — "Online" (green), "Offline" (red), or "Sync Pending" (orange) |
| Created On | Date and time when the connector was created |
| Actions | Edit and delete buttons for quick access |
Table features:
- Search — Filter by display name or description.
- Column filters — Click the filter icon in a column header for advanced filtering. Type and Active columns have dropdown filters.
- Sorting — Click a column header to sort ascending or descending.
- Column selection — Use the column picker to show or hide columns.
- Pagination — Navigate between pages at the bottom of the table.
- Export — Export the table data to an Excel file (.xlsx).
Creating a Connector
- Click the + button in the table toolbar. You are taken to the Add Connector page.
- Fill in the required fields:
- Type (required) — Select one of: MQTT Subscriber, IEC 60870-5-104 Server, IEC 60870-5-104 Client, HTTP-Server + Webhook, or HTTP-Receiver.
- Display Name (required) — A descriptive name for the connector (max. 200 characters).
- Log Level (required) — The logging verbosity. Defaults to "Info".
- Host (required) — The address of the broker or target system (max. 500 characters).
- Port (required) — The port number (1–65,535). Defaults to 1883 for MQTT, 2404 for IEC 104 (Server and Client), or 5000 for REST connectors.
- Active — Toggle switch to enable or disable the connector. New connectors are active by default.
- Description (optional) — Additional notes (max. 1,000 characters).
-
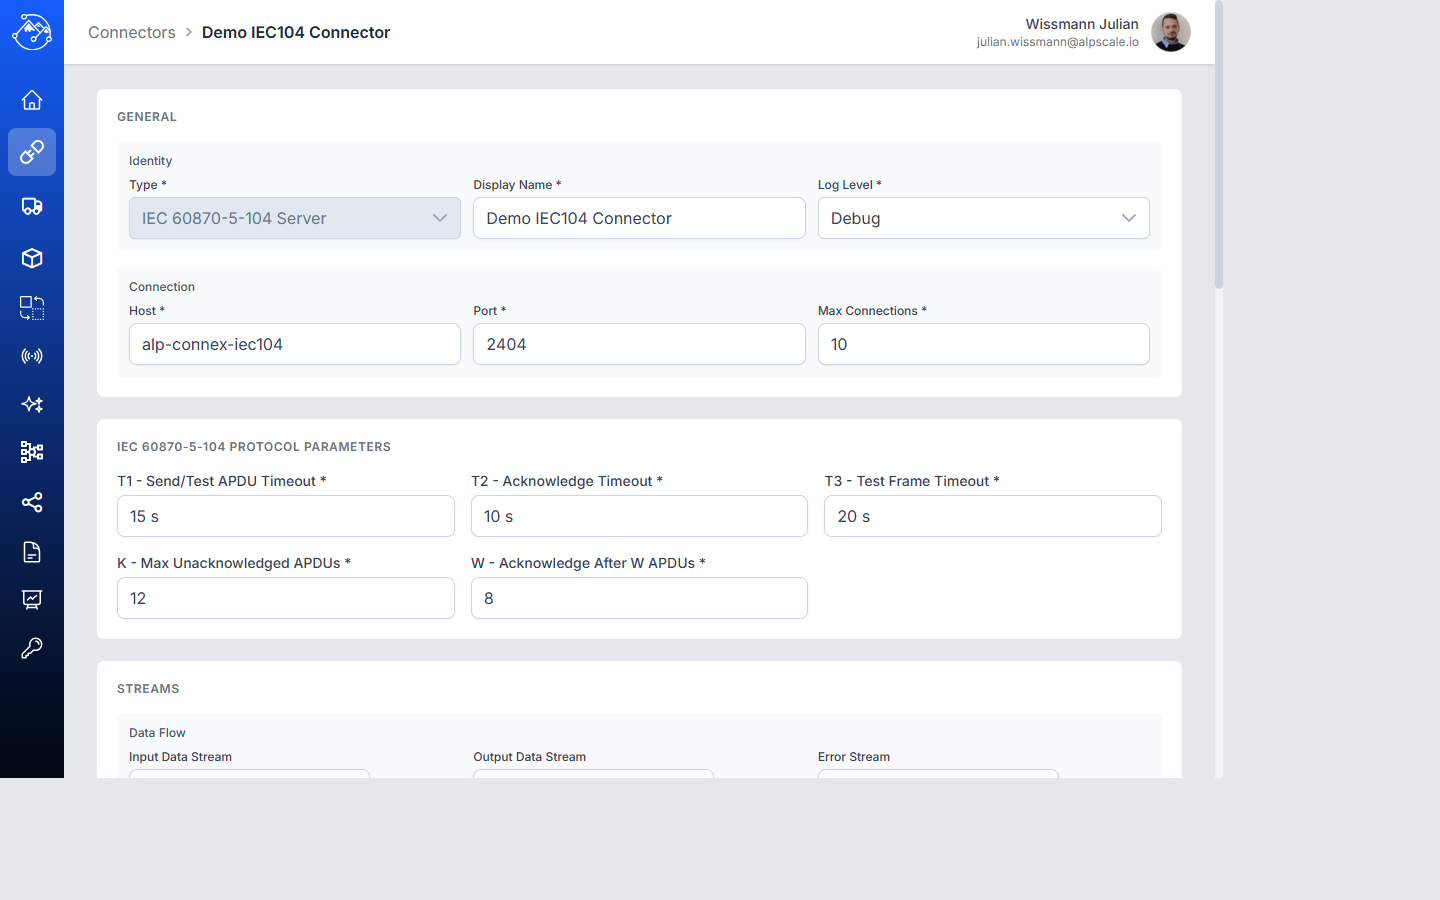
IEC 60870-5-104 Server only — When "IEC 60870-5-104 Server" is selected as the type, additional protocol parameters are shown:
Field Description Default Max Connections Maximum number of simultaneous client connections 1 T1 — Send/Test APDU Timeout Timeout for send or test APDUs (seconds) 15 T2 — Acknowledge Timeout Timeout for acknowledging received APDUs (seconds) 10 T3 — Test Frame Timeout Timeout for sending test frames (seconds) 20 K — Max Unacknowledged APDUs Maximum number of unacknowledged I-format APDUs 12 W — Acknowledge After W APDUs Send S-format acknowledgement after this many APDUs 8 MQTT Subscriber only — When "MQTT Subscriber" is selected, additional authentication fields are shown:
Field Description Username MQTT broker username for authentication (optional, max. 200 characters) Password MQTT broker password (optional; stored encrypted with AES-GCM; leave blank when editing to keep existing password) When a username is provided, a password is required.
-
Stream Configuration (optional, all connector types):
Field Description Input Data Stream Name of the data stream the connector reads data from (autocomplete from existing streams) Output Data Stream Name of the data stream the connector writes data to (autocomplete from existing streams) Error Stream Name of the data stream for error reporting (auto-suggested based on connector name) Streams can be selected from existing streams via autocomplete or created by typing a new name.
-
Click Save to create the connector, or Cancel to return to the list.
Editing a Connector
- Click a row in the table. You are taken to the Edit Connector page.
- Modify the fields as needed. The Type and ID fields cannot be changed.
- Click Save to apply the changes, or Cancel to discard.
In edit mode, the connector ID is displayed at the top with a copy button for easy reference (e.g., for use in deployment configuration).
Linking Mappings to a Connector
In edit mode, a Linked Mappings section appears below the form. This allows you to associate data point mappings with a connector.
To link mappings:
- Use the dropdown at the top of the section to search for and select mappings.
- Click Link to associate the selected mappings.
To unlink a mapping:
- Click the unlink button next to the mapping.
- Confirm in the dialog.
Each linked mapping is shown as a clickable row displaying its name, type tag, and active status. Clicking a mapping navigates to its detail page.
When more than 5 mappings are linked, a search field appears to filter the list.
Deleting Connectors
Select one or more rows using the checkboxes, then click the delete button in the toolbar. Confirm in the dialog.
Mappings
Mappings define how incoming JSON data is translated into IEC 104 data points. Each mapping extracts a value (and optionally a timestamp) from a JSON payload and assigns it to a specific IEC 104 address.
Mapping List
The mapping list displays all mappings in a sortable, filterable table.
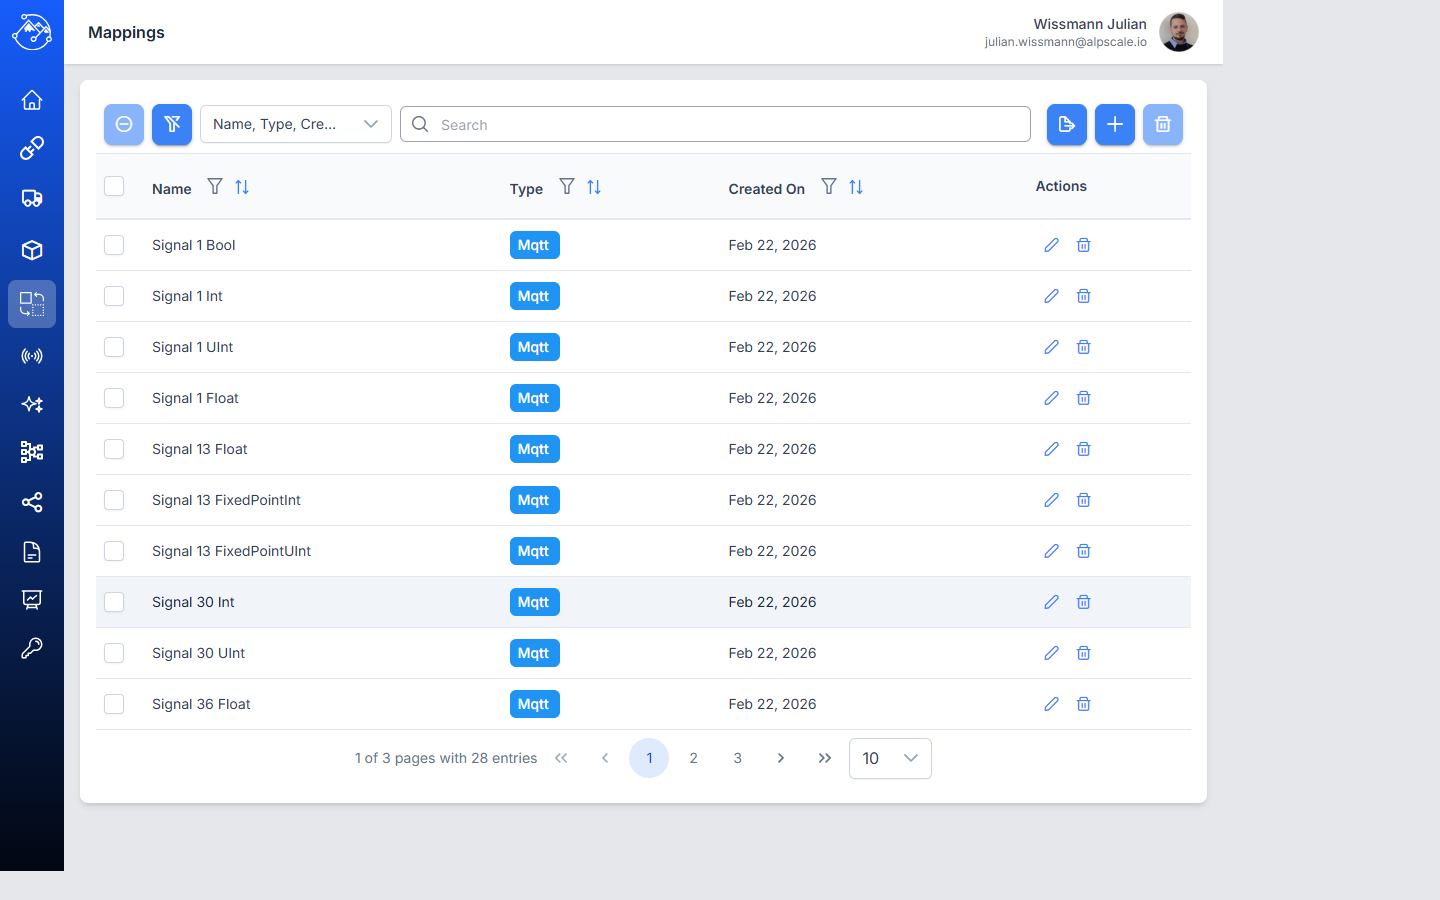
Available columns:
| Column | Description |
|---|---|
| Name | The mapping name |
| Topic | The topic or identifier this mapping is associated with |
| CASDU | Common Address of ASDU — the station address, shown as two bytes |
| IOA | Information Object Address — the data point address, shown as three bytes |
| Type | The IEC 104 data type — shown as a colored tag |
| Created On | Date and time when the mapping was created |
Table features: Same as the Connector list (search, filters, sorting, column selection, pagination, export).
Creating a Mapping
-
Click the + button in the table toolbar. You are taken to the Add Mapping page.
-
Fill in the required fields:
General:
- Mapping Type (required) — The connector type this mapping applies to (e.g., MQTT, REST).
- Name (required) — A descriptive name for the mapping (max. 200 characters).
- Topic (required) — The topic or identifier to subscribe to (max. 500 characters), e.g.,
sensors/temperature.
IEC 104 Addressing:
- CASDU Byte 1 and Byte 2 (required) — The station address, entered as two individual bytes (0–255 each).
- IOA Byte 1, Byte 2, and Byte 3 (required) — The data point address, entered as three individual bytes (0–255 each).
- Type (required) — The IEC 104 data type (Type 1, 3, 13, 30, 31, 32, 36, 45, 46, 47, 50).
Value Data Point:
- Path (required) — JSON path expression pointing to the value in the MQTT payload (e.g.,
$.data.value, max. 500 characters). - Type (required) — The data type of the extracted value (Bool, Int, UInt, Float, Double, FixedPointInt, FixedPointUInt).
- Point Position — Only shown when the value type is FixedPointInt or FixedPointUInt.
Timestamp Data Point (only for Type 30 and Type 36):
- Path — JSON path to a timestamp in the MQTT payload (e.g.,
$.timestamp). - Type — The timestamp format (IsoTimeStamp or UnixTimeStamp).
- Duration Unit — Only shown when the timestamp type is UnixTimeStamp (e.g.,
ms).
Default Value (optional, per data point):
- A fallback value used when the JSON payload does not contain the expected field or when the extracted value is invalid. The default is validated against the selected data type.
Cause of Transmission (CoT) (optional):
- Test — Whether the data point is marked as test data.
- Negative — Whether the transmission is a negative confirmation.
- Cause — The transmission cause value (e.g., spontaneous, interrogated).
-
Click Save to create the mapping, or Cancel to return to the list.
Editing a Mapping
- Click a row in the table. You are taken to the Edit Mapping page.
- Modify the fields as needed. The Mapping Type and ID fields cannot be changed.
- Click Save to apply the changes, or Cancel to discard.
In edit mode, the mapping ID is displayed at the top with a copy button.
Linking Connectors to a Mapping
In edit mode, a Linked Connectors section appears below the form. This works the same way as linking mappings to a connector (see above), but in reverse — you associate connectors with a mapping.
Each linked connector shows its name, type tag (MQTT/IEC 104), and active/inactive status. Clicking a connector navigates to its detail page.
Linking Signals to a Mapping
In edit mode, a Linked Signals section appears below the form. This allows you to associate IEC 104 signals (address points) with a mapping. Signals define the target CASDU+IOA addresses that the mapping writes to.
To link signals: Use the dropdown to search for and select signals. Click Link to associate them.
To unlink a signal: Click the unlink button next to the signal. Confirm in the dialog.
Each linked signal shows its name, type tag, and CASDU+IOA address. Clicking a signal navigates to its detail page. When linking a signal, the system validates that the signal's IEC 104 type matches the mapping's type.
Deleting Mappings
Select one or more rows using the checkboxes, then click the delete button in the toolbar. Confirm in the dialog.
Understanding Value Paths
The Path field uses JSON path expressions to extract values from incoming messages. For example, given the following JSON payload:
{
  "data": {
    "value": 23.5,
    "unit": "°C"
  },
  "timestamp": "2026-01-15T10:30:00Z"
}
- Value Path
$.data.value→ extracts23.5 - Timestamp Path
$.timestamp→ extracts"2026-01-15T10:30:00Z"
Signals
Signals define the IEC 104 address points that are available in the system. Each signal represents a unique combination of CASDU + IOA with a specific IEC 104 data type. Signals can be linked to mappings to define which address a mapping writes to. The signal list also shows live values received from the process image in real time.
Signal List
The signal list displays all signals in a sortable, filterable table.
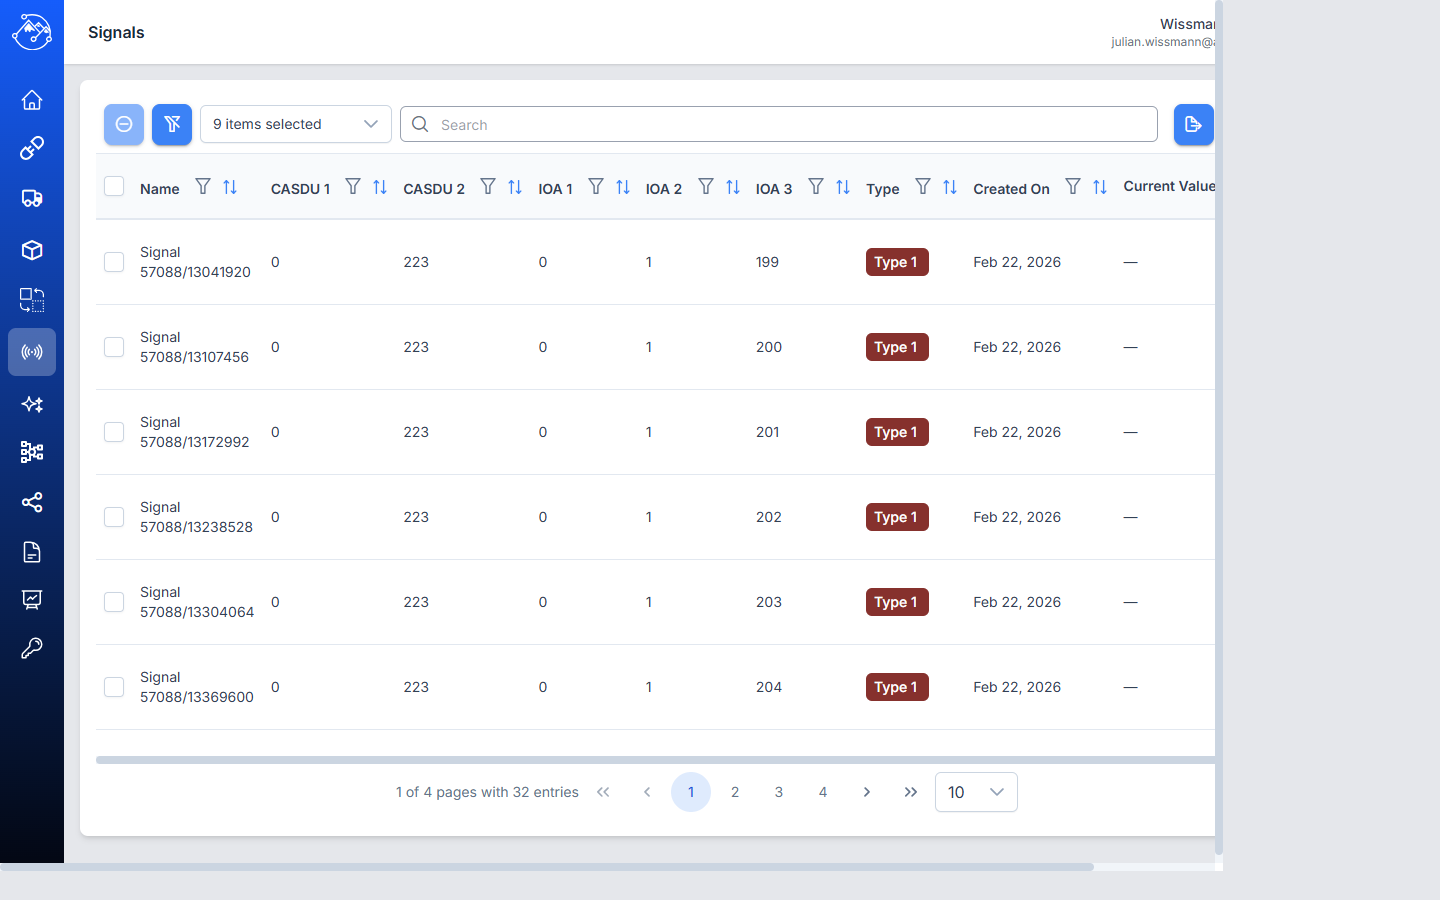
Available columns:
| Column | Description |
|---|---|
| Name | The signal display name |
| CASDU 1 / CASDU 2 | The station address bytes |
| IOA 1 / IOA 2 / IOA 3 | The data point address bytes |
| Type | The IEC 104 data type (Type 1–50) — shown as colored tag |
| Created On | Date and time when the signal was created |
Table features: Same as other list views (search, filters, sorting, column selection, pagination, export).
Creating a Signal
- Click the + button in the table toolbar.
- Fill in the required fields:
- Name (required) — A descriptive name for the signal.
- Type (required) — The IEC 104 data type (Type 1, 3, 13, 30, 31, 32, 36, 45, 46, 47, 50).
- CASDU 1 / CASDU 2 (required) — The station address as two bytes (0–255 each).
- IOA 1 / IOA 2 / IOA 3 (required) — The data point address as three bytes (0–255 each).
- The system checks address availability in real time and shows a warning if the CASDU+IOA combination is already in use.
- Click Save to create the signal, or Cancel to return to the list.
Editing a Signal
- Click a row in the table.
- Modify fields as needed. The ID cannot be changed.
- Click Save or Cancel.
Linking Signals to Mappings
Signals can be linked to mappings from the Mapping detail page (see Mappings section). Each mapping can have one or more linked signals that define the target IEC 104 addresses.
Deleting Signals
Select one or more rows using the checkboxes, then click the delete button in the toolbar. Confirm in the dialog.
Workflow
Experimental — This feature is marked as experimental and may change in future releases.
The Workflow page is an interactive editor for designing and managing data flows through your system. It provides a visual canvas where you can place connector nodes, connect them with data streams, and monitor live throughput.
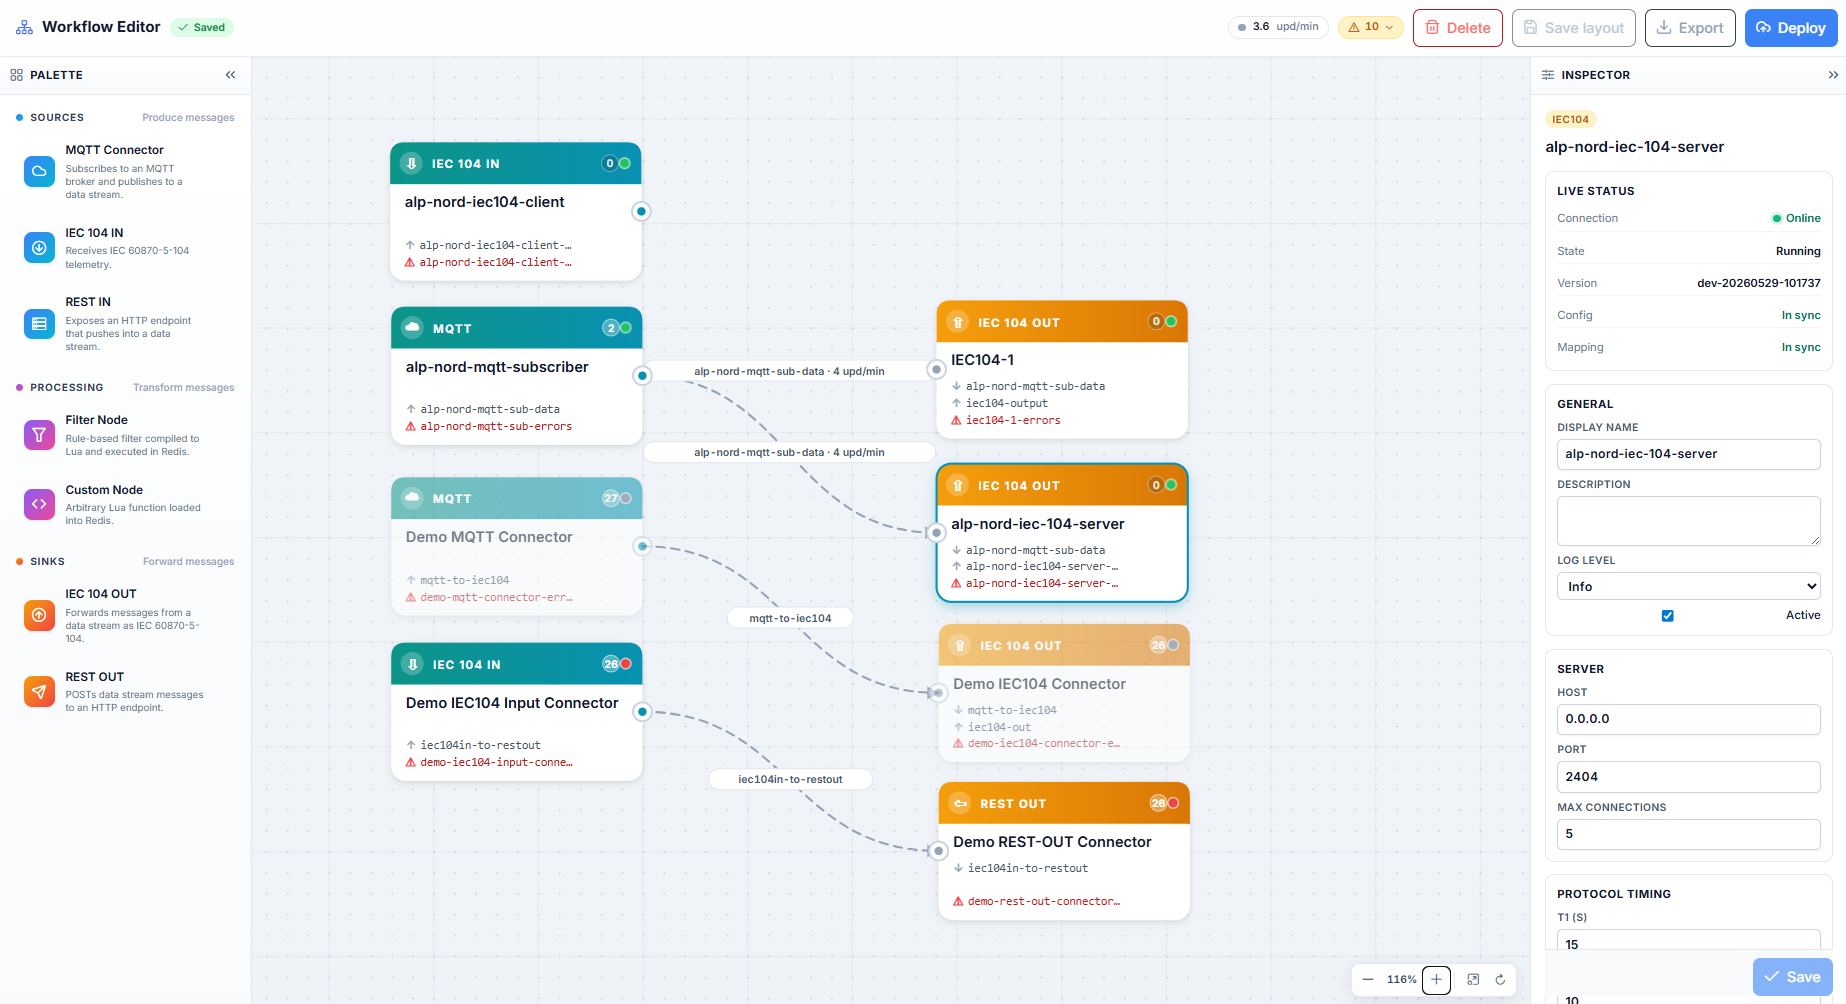
Layout
The editor is divided into three panels:
| Panel | Content |
|---|---|
| Palette (left) | Draggable node types organized into Sources, Processing, and Sinks |
| Canvas (center) | The main editing area where nodes are placed and connected |
| Inspector (right) | Properties and configuration of the selected node or edge |
Palette
The palette provides the building blocks for your data flow:
Sources — Produce messages:
- MQTT Connector — Subscribes to a broker and publishes to a data stream
- IEC 104 IN — Receives IEC 60870-5-104 telemetry
- REST IN — Exposes an HTTP endpoint that pushes into a data stream
Processing — Transform messages:
- Filter Node — Rule-based filter for message processing
- Custom Node — Custom processing logic
Sinks — Forward messages:
- IEC 104 OUT — Forwards messages as IEC 60870-5-104
- REST OUT — Sends data stream messages to an HTTP endpoint
Canvas
The canvas displays all connector nodes with their data streams. Each node shows:
- The connector type and name
- Connected data streams (output and error streams)
- A status badge with the current message count
- A colored indicator showing online (green) or offline (red) status
Edges between nodes represent data streams and display live throughput (e.g., "3 upd/min").
Inspector
Click any node or edge on the canvas to view and edit its properties in the Inspector panel.
Toolbar
The toolbar at the top provides:
- Live throughput indicator (e.g., "1.4 upd/min")
- Error count badge with link to affected streams
- Delete — Remove selected nodes
- Save layout — Persist the current node arrangement
- Export — Export the workflow configuration
- Deploy — Apply the workflow to the running system
Interactions
- Drag nodes from the palette onto the canvas
- Click a node or edge to inspect its properties
- Right-click for context menu options
- Scroll to zoom in/out
- Use the zoom controls at the bottom of the canvas
Streams
The Streams page provides an overview of all data streams in the system. Data streams are the asynchronous channels that connectors use to exchange data — each connector reads from or writes to one or more streams.
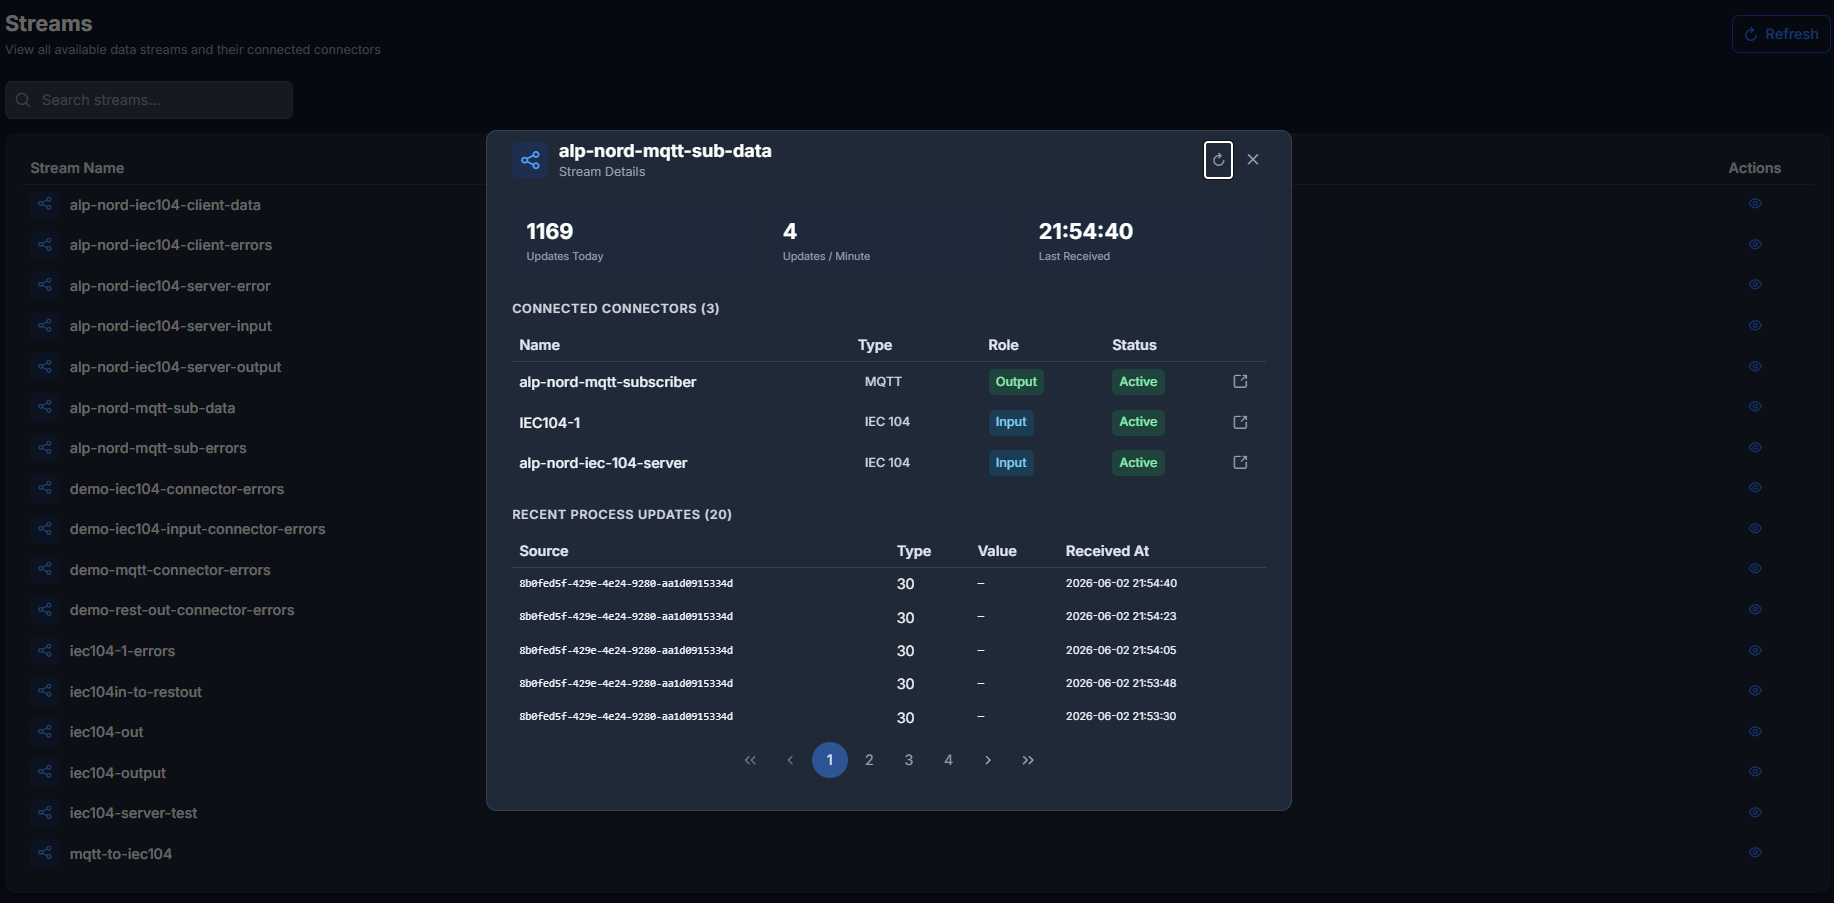
Stream List
A searchable list of all active streams. Each stream is shown with its name and a view button.
- Search — Filter streams by name using the search bar
- Refresh — Reload the stream list
Stream Detail Dialog
Click the view button on any stream to open a detail dialog showing:
- Connected Connectors — Which connectors read from or write to this stream
- Recent Process Updates — The latest data entries in the stream
- Stream Statistics — Live metrics about stream activity
Process Updates
The Process Updates page provides a real-time view of all data flowing through your connectors. It shows every value change as it happens, giving you complete visibility into your system's activity.
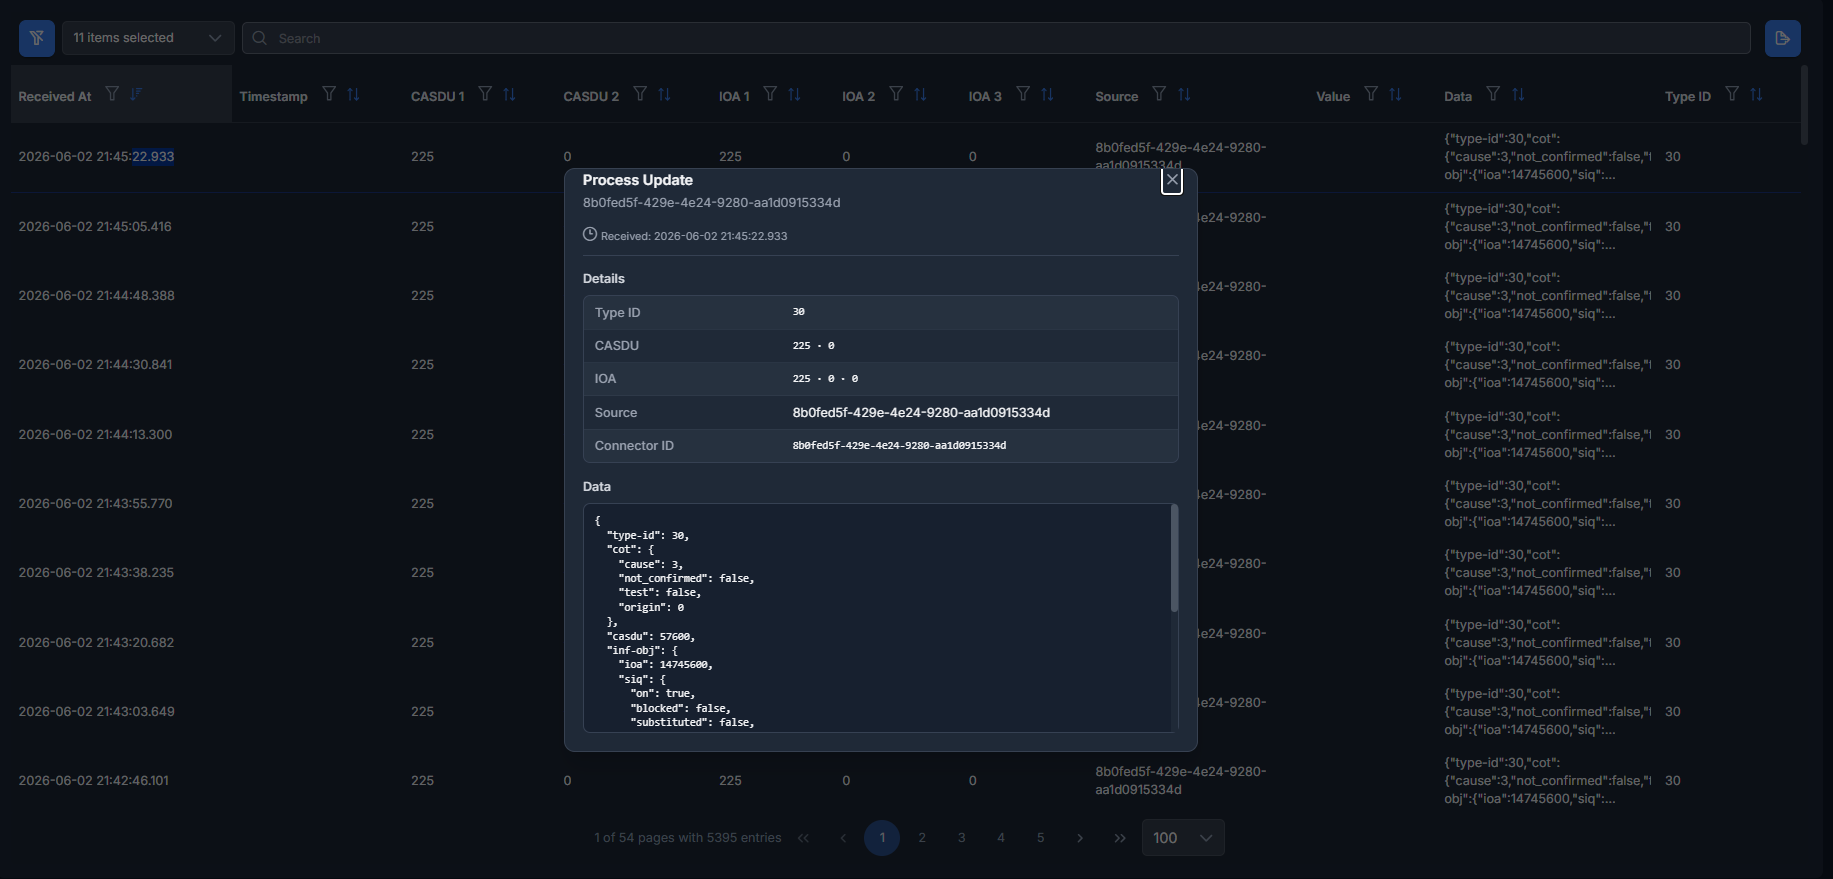
Available Information
| Column | Description |
|---|---|
| Timestamp | When the update occurred |
| Connector | Which connector processed the update |
| CASDU | The station address (IEC 104) |
| IOA | The data point address (IEC 104) |
| Value | The actual value that was processed |
| Quality | Quality flags associated with the value |
Filtering
Use the column filters to narrow down the view:
- Filter by connector to see activity from a specific adapter
- Filter by CASDU/IOA to track a specific data point
- Filter by time range to analyze historical activity
Export
Process update data can be exported to an Excel file (.xlsx) for external analysis or reporting.
Real-Time Updates
The page uses WebSocket streaming to deliver updates in real time. New entries appear automatically at the top of the list without requiring a page refresh.
Audit Logs
The Audit Logs section provides a complete history of all changes made in the system. This is a read-only view — entries cannot be modified or deleted.
Available Information
| Column | Description |
|---|---|
| Timestamp | When the action occurred |
| User Name | Who performed the action |
| User Email | Email address of the user (hidden by default, can be enabled via column picker) |
| Action | What was done — Create, Update, Delete, or Configure |
| Entity Type | What was affected (e.g., Connector, Mapping) |
| Entity Name | The name of the affected item |
Actions are displayed as colored tags:
- Create — Green
- Update — Orange
- Delete — Red
- Configure — Blue
Filtering and Searching
Use the search bar to filter by user name, email, entity type, or entity name. Column-level filters are also available for more precise filtering. The Action column has a dropdown filter.
Export
Audit log data can be exported to an Excel file (.xlsx) for external reporting or compliance purposes.
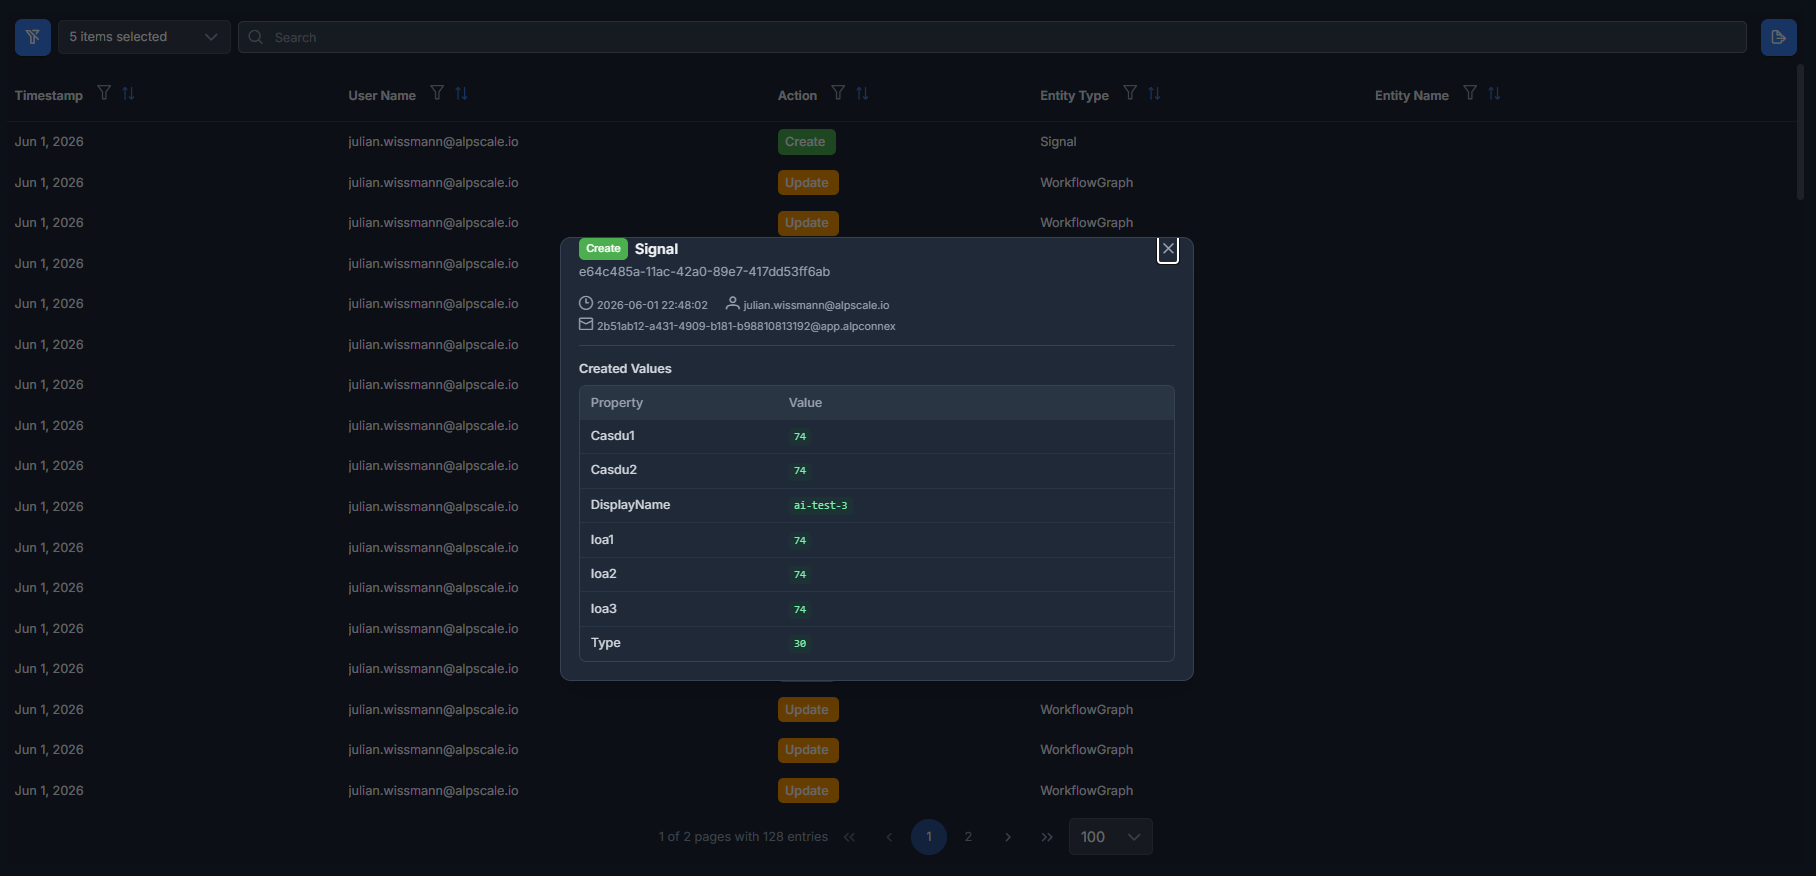
Detail View
Click any audit log row to open a detail dialog showing:
- Full metadata (timestamp, user, action, entity)
- A diff view comparing the old and new values of the changed entity (JSON key-value comparison)
This allows you to see exactly what was modified in each update.
Fleet Management
Experimental — The Fleet Management page is only available when the Fleet Management backend is deployed and configured.
The Fleet Management page provides centralized monitoring and control of all edge devices running ALP-CONNEX connectors.
KPI Cards
Summary cards at the top show the current fleet state:
- Total Devices — Number of registered devices
- Online — Devices with an active heartbeat and healthy status
- Warnings — Devices with degraded health (high CPU, memory, or disk usage)
- Offline — Devices that haven't sent a heartbeat recently
Device Table
A sortable, filterable table listing all registered devices:
| Column | Description |
|---|---|
| Device Name | The registered device name |
| Site | The site the device belongs to |
| Status | Online (green), Warning (orange), Offline (red) |
| Architecture | Hardware architecture (e.g., ARM64, AMD64) |
| IP Address | Device network address |
| Connectors | Running connector types shown as colored badges |
| Health | Health score (0–100%) with visual indicator |
| Last Seen | Time since the last heartbeat |
Filters:
- Search by name, site, or IP address
- Filter by status (All / Online / Warning / Offline)
- Filter by site
- Auto-refresh interval selector (5s, 10s, 30s, 60s, or off)
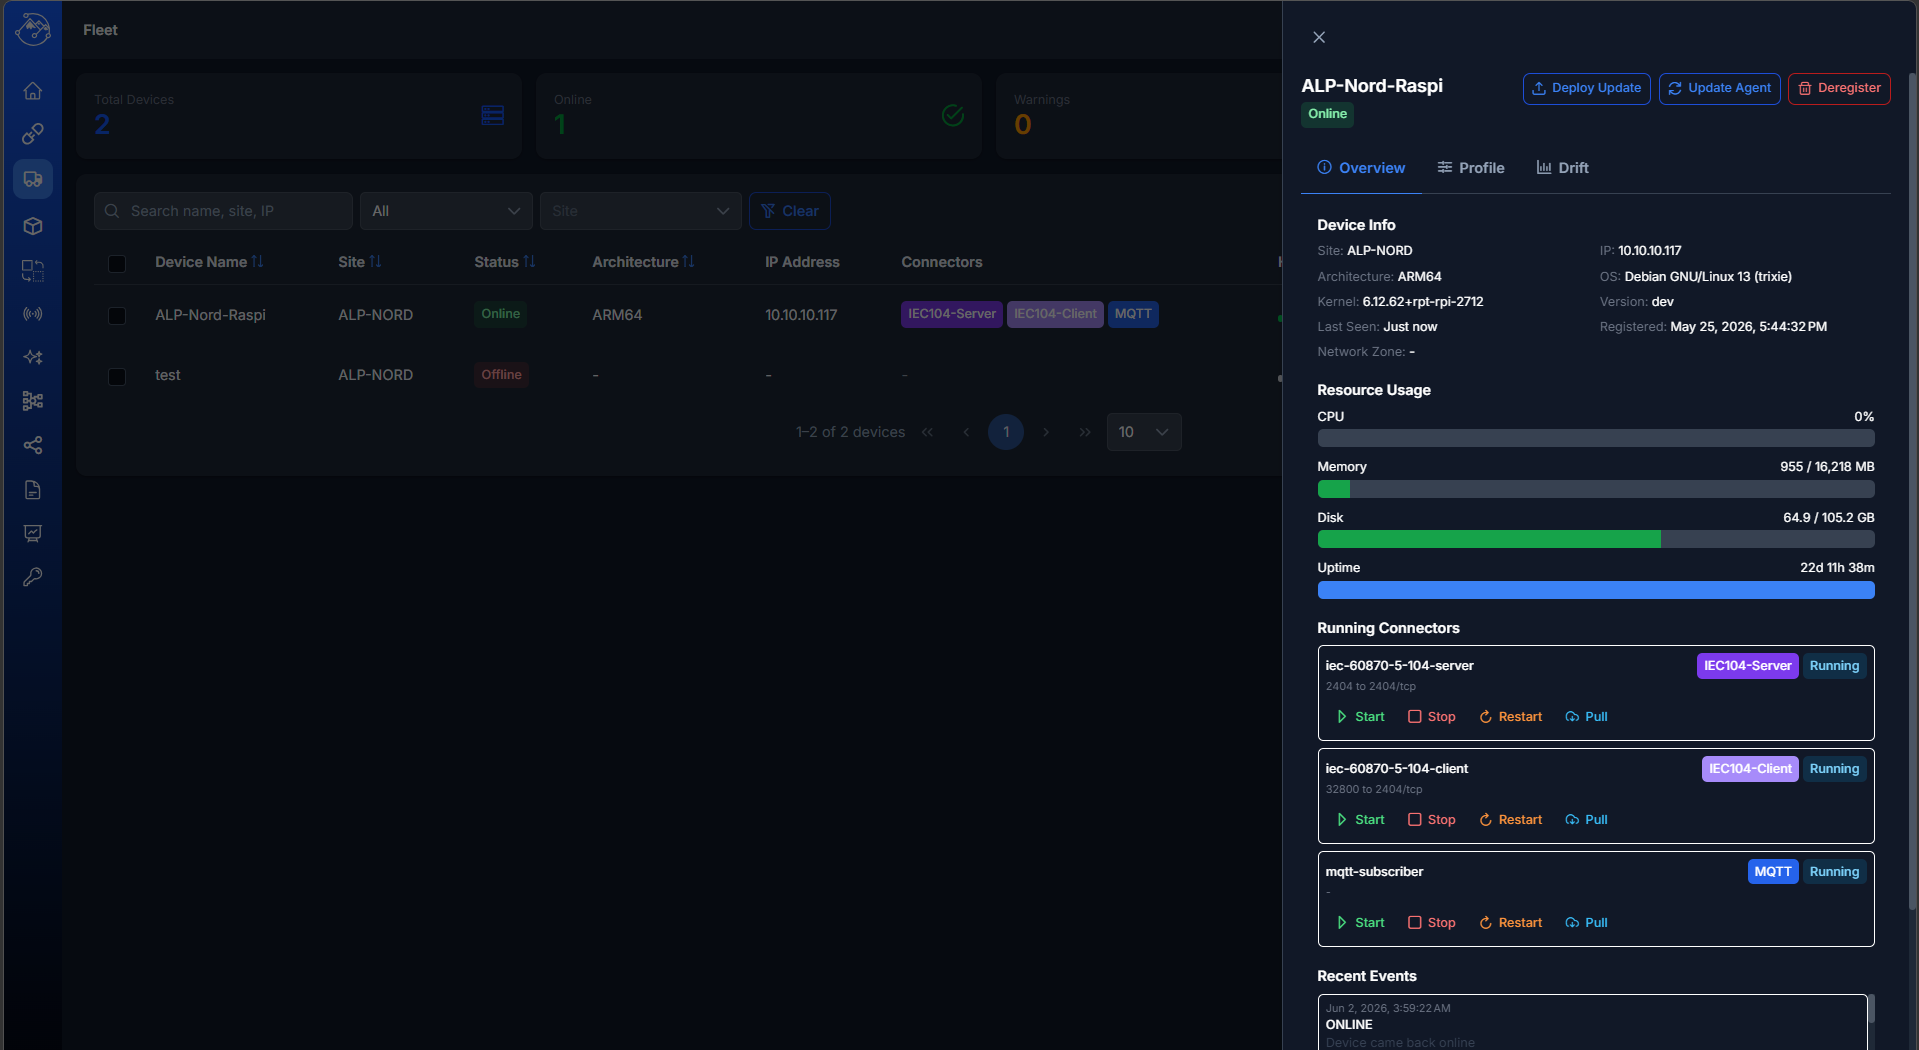
Device Detail Drawer
Click any device to open a side drawer with multiple tabs:
Overview tab:
- System Metrics — CPU, RAM, and disk usage as progress bars
- Device Info — OS, kernel, architecture, uptime, IP address, software version
- Running Connectors — List of ALP-CONNEX connectors discovered on the device with per-connector actions (Start, Stop, Restart, Pull)
- Event History — Recent events and command results
Profile tab:
- View and edit the device's configuration profile
- Apply a profile to define which connectors should run on the device
Drift tab:
- Shows differences between the expected profile configuration and the actual device state
Device Registration
Click Register Device to add a new edge device:
- Enter a Device Name and select or create a Site
- The system generates a registration token (valid 24 hours) and a ready-to-use install command
- Copy the install command and run it on the target device
Remote Commands
Use the device detail drawer to send commands to a device:
- Restart Connectors — Restarts all connector containers
- Update — Pulls a specified image and restarts the target container
- Configure — Pushes a configuration payload to the device
Commands are queued and executed on the next device heartbeat.
Connector Templates
Experimental — This feature is part of Fleet Management.
The Connector Templates page allows you to define reusable connector configurations that can be applied to device profiles. Instead of manually configuring each device, you create templates and assign them to profiles for consistent fleet-wide deployment.
Templates are managed via a dedicated list page accessible from the sidebar.
AI Insights
Experimental — The AI Insights tab is only available when the optional AI service is deployed and configured. When no LLM endpoint is reachable, the menu entry is hidden and the rest of the application is unaffected.
The AI Insights page brings the optional ALP-CONNEX AI Service directly into the Management UI. It gives operators plain-language explanations of what the live process image is doing, suggests prioritized actions for individual data points, summarizes a signal over a chosen time window, and offers a streaming chat assistant that has the current process image as context. The AI never issues control commands by itself — every result is presented for review.
Status Bar
A status bar at the top of the page shows the health of the AI stack as colored badges:
| Badge | Meaning |
|---|---|
| AI-Service | Reachability of the AI service container |
| Hailo | Local AI accelerator (only relevant on edge deployments) |
| ChromaDB | Vector store backing the Knowledge Base |
| Valkey | Shared in-memory data store the AI service reads from |
| Knowledge Base | Number of documents currently indexed |
| Model | Name of the active language model (e.g., gpt-4o-mini); the LLM provider is shown as a tooltip |
A Refresh status button re-checks all components on demand.
Knowledge Base
A toolbar above the panels lets you manage the operator knowledge that the AI is grounded on:
- Upload KB document — Add a
.pdf,.md,.csvor.txtfile. The document is chunked, embedded, and stored in ChromaDB. A status badge confirms success or surfaces the error message. - Reindex KB — Rebuild the entire vector index from the currently uploaded documents. A confirmation dialog is shown before the operation runs.
Uploaded documents are automatically used as additional context for Recommend, Explain, Analyze, and Chat.
Recommend
Returns a context-aware action proposal for one specific data point.
Inputs
| Field | Description |
|---|---|
| CASDU | Common Address of ASDU of the data point |
| IOA | Information Object Address of the data point |
Click Request recommendation to send the request. The AI service reads the live value, recent history, and quality of the addressed data point and combines it with relevant Knowledge Base entries.
Output
- A severity badge (
info,warning,critical) summarising the situation - A short summary describing the current state and trend
- An Actions list with one or more proposals; each action shows a title, a short rationale, and a priority badge (
low,medium,high)
Explain
Produces a plain-language interpretation of a single data point. Click Load explanation to fetch the answer for the CASDU/IOA pair currently selected in the Recommend panel.
The response includes the current value, the detected trend (stable, rising, falling), the quality, and a structured JSON object with severity, summary, and a list of follow-up actions — useful for shift handover or for documenting an incident.
Analyze
Generates a statistical and qualitative summary of a signal over a configurable time window.
Inputs
| Field | Description |
|---|---|
| CASDU | Common Address of ASDU of the data point |
| IOA | Information Object Address of the data point |
| Time window | Aggregation window (e.g., 1 h, 24 h) |
Output
Four numeric badges show min, max, mean, and standard deviation for the selected window, followed by a structured AI summary with severity, narrative, and proposed actions.
Chat
A streaming operator assistant. Type a question into the Ask AI… field and press Send. Replies are streamed token by token and have the live process image plus the Knowledge Base as context, which makes the chat suitable for ad-hoc diagnostics across multiple signals ("compare bay 1 and bay 2 voltage in the last hour", "which signals currently report invalid quality?", "what would you check first given the recent trip on CASDU 225?"). Beyond diagnostics, the chat assistant can also configure the system directly. You can ask it to create, update, or delete connectors, signals, and mappings in natural language — for example: "Create an MQTT connector called Weather Station on port 1883" or "Add a signal for temperature at CASDU 225, IOA 100". Destructive operations require explicit confirmation before execution. The chat keeps the conversation history within a single session.
Licensing
The Licensing section shows your current license status and allows you to update your license key.
License Information
The license card displays:
| Field | Description |
|---|---|
| Status | Whether the license is Valid (green) or Invalid (red) |
| Licensee | The organization or person the license is issued to |
| Expiration Date | When the license expires, including days remaining |
| Max Connectors | Maximum number of connectors allowed (∞ = unlimited) |
| Max Mappings | Maximum number of mappings allowed (∞ = unlimited) |
The expiration date is color-coded:
- Green — More than 30 days remaining
- Orange — 30 days or fewer remaining
- Red — 7 days or fewer remaining
Updating Your License Key
- Enter your new license key in the License Key field.
- Click Update Key.
- The license information will refresh automatically.
Contact your administrator or support if you need a new license key.
Profile
The Profile page shows your account information as provided by your organization's Microsoft Entra ID directory.
Displayed Information
- Profile Photo — Your Microsoft account photo (or initials if no photo is available)
- Display Name — Your full name
- Email — Your email address
- Roles — Any application roles assigned to you, shown as colored badges
Theme
The Profile page includes a theme selector with three options:
| Option | Description |
|---|---|
| Light | Light background with dark text |
| System | Automatically follows your operating system's preference |
| Dark | Dark background with light text |
Your theme preference is saved and persists across sessions.
Logout
Click the Logout button to sign out of the application. You can also use the logout icon at the bottom of the sidebar.
Table Features (All List Views)
All list views (Connectors, Mappings, Audit Logs) share common table functionality:
Search
Type in the search bar to filter across multiple columns simultaneously. The search updates in real time.
Column Filters
Click the filter icon (≡) in any column header to open advanced filter options:
- Text columns: Contains, Equals, Starts with, Ends with
- Numeric columns: Equals, Greater than, Less than
- Date columns: Date is, Date before, Date after
- Enum columns: Dropdown with predefined values
Sorting
Click a column header to sort by that column. Click again to reverse the sort order.
Column Selection
Use the column picker dropdown to choose which columns are visible.
Pagination
Use the page controls at the bottom of the table to navigate through results. Select the number of rows per page (10, 25, 50, or 100).
Row Selection
Click the checkbox in the leftmost column to select rows for batch operations (e.g., bulk delete).
Export
Click the export button in the toolbar to download the current table data as an Excel file (.xlsx).
Responsive View
On smaller screens (tablets, mobile), the table automatically switches to a card-based layout where each row is displayed as a compact card.
Error Notifications
The application shows toast notifications in the top-right corner of the screen for important events:
| Type | Color | Examples |
|---|---|---|
| Success | Green | Connector saved, mapping created, license updated |
| Error | Red | Server not reachable, validation failed, permission denied |
Success notifications disappear automatically after a few seconds. Error notifications are also shown automatically when a server request fails (e.g., network error or server-side validation error).
For technical details about the ALP-CONNEX platform, see the ALP-CONNEX Overview.